Working with data is awesome. Students often struggle with introductory Statistics courses, and I always encourage them to stick with it- once you get the conceptual basics under your belt, stats is really fun and empowering. I’m hoping the preliminary data will guide future growth; three months in, there is already good data to work with.
WordPress has a plug-in that tracks site visits over 30 days:
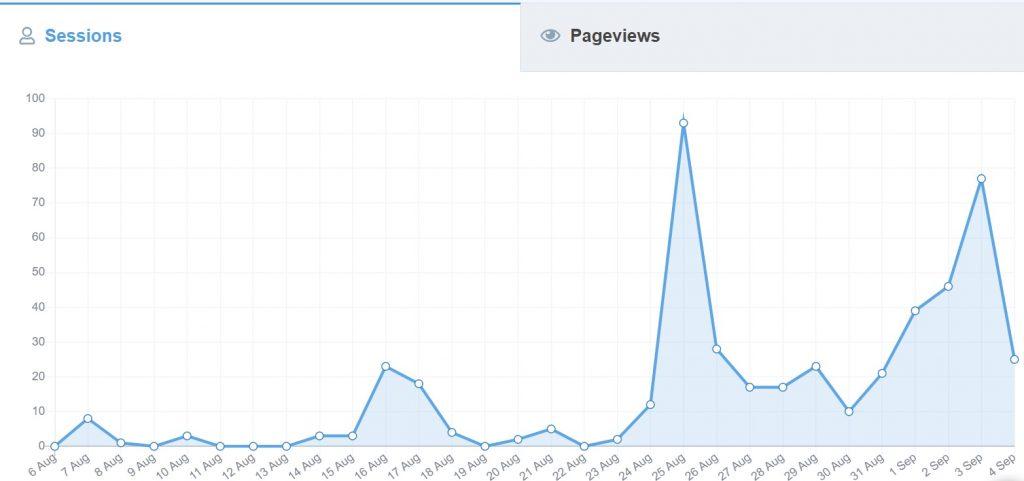
I’m encouraged by the overall growth in site-visits. The peak around the 25th I largely attribute to a student submission, which is still the most popular click on the website. It was advertised on the Euphoria reddit page (r/Euphoria), which got significant play.
These are the top five posts in terms of clicks.

This is a strong indication that audiences are interested in student work. I’ll be doubling down on submission-seeking, though it’s helpful for writers to know who their audience is. Since WordPress doesn’t provide much data about WHO is clicking, I turned to Facebook.
Fact: Facebook knows who you are and everything you click on/interact with.
Fact: This is dystopian at the worst and deeply problematic at best.
Fact: This is incredibly helpful information for marketing.
I placed an ad on Facebook and spent $13.99 on it. I won’t be having any bubble tea this week, but the data is worth it (rationalization).
Audiences saw one of five house-made original memes, along with the mission of the site (Accessible, empirically-supported, and practical educational resources for transitional-age youth). This reached 2,382 people, with 305 clicking on the link to the website (about 13%).
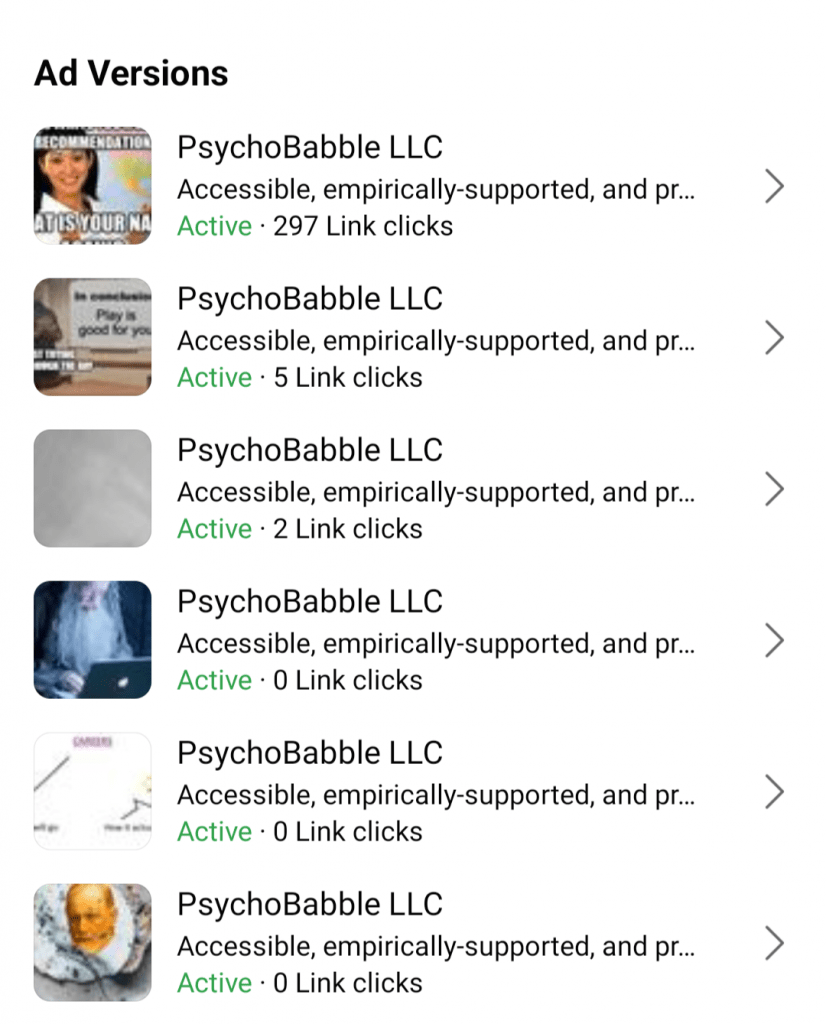
“Unhelpful Teacher” was most popular ad, no contest. I honestly thought that “Freud Egg” would get more love.
Among the people who decided to visit the website, they were predominately male BY FAR
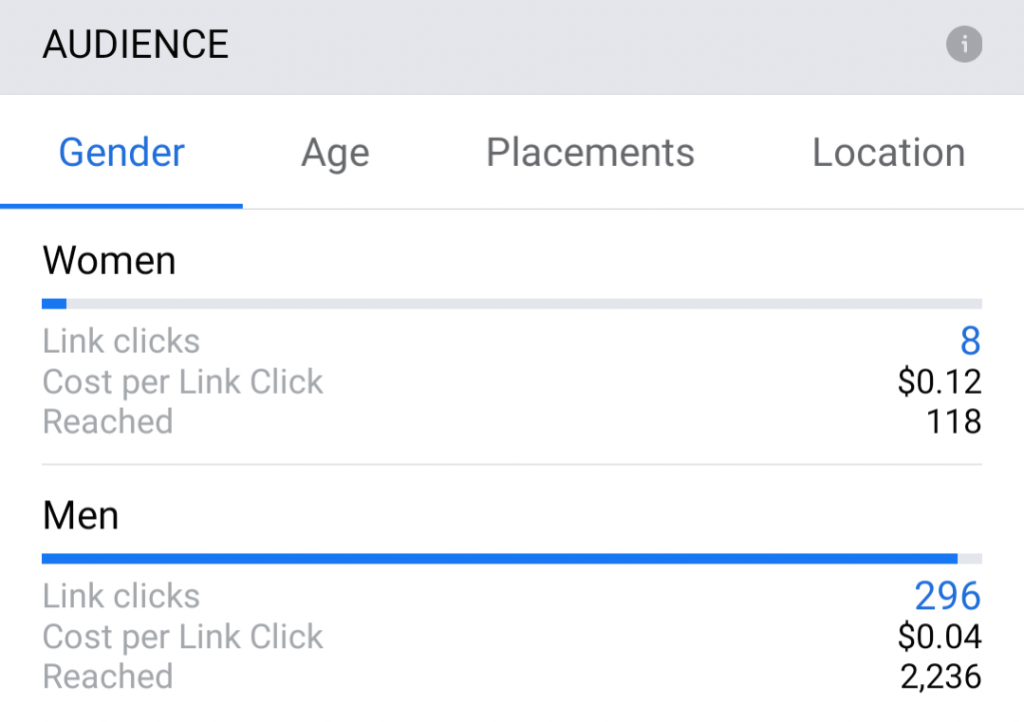
This one was a surprise. Does this reflect a need among male populations, or is something about the ad? I’d like to use another ad format and see if these results can be reproduced.
Even more shocking was the age of clicking participants. The mission of the website is to support transitional-age people, but that’s not who visited the site.
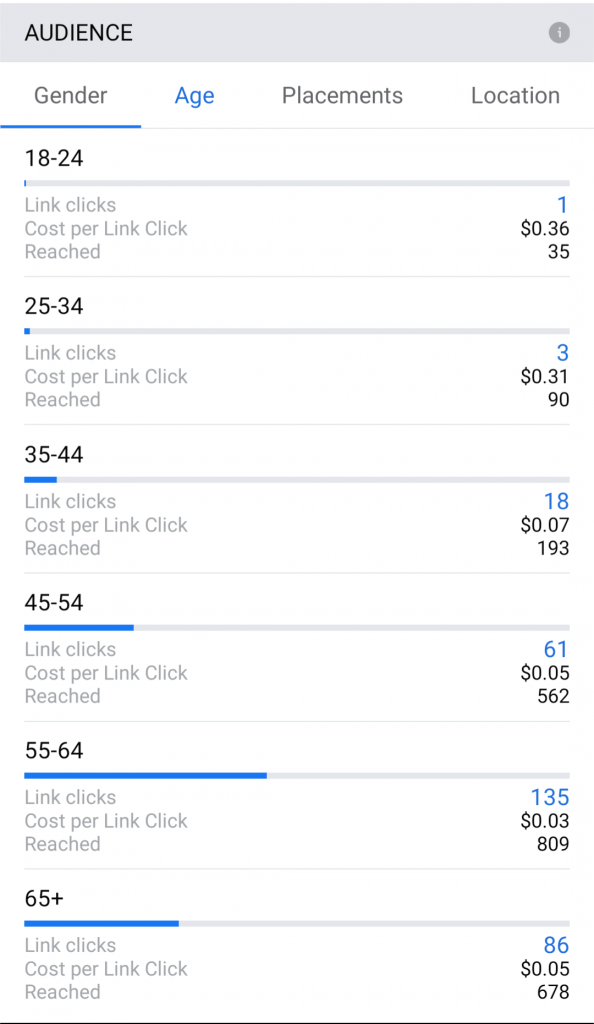
As the data shows, the vast majority of interested parties was 45+. As before, I don’t know if this is where the need/interest is, or if the data is just a function of the ad. If this trend continues, does the mission need to change?
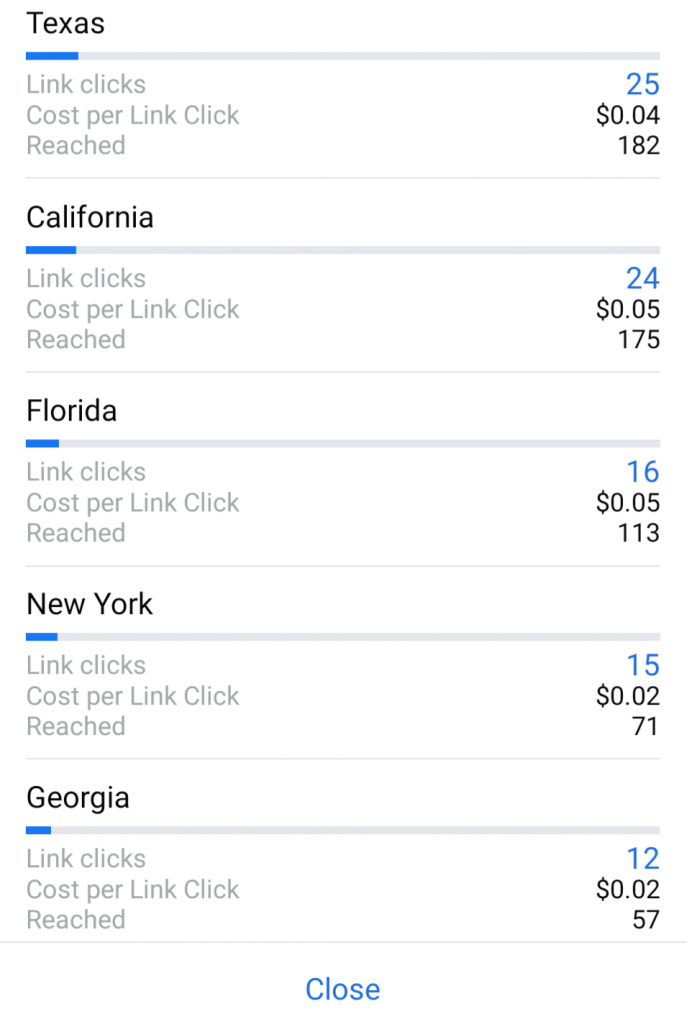
The last piece of helpful info is where are people clicking from, and all were in the United States. These were the top-5 states who clicked on my ad.
While I continue to interpret the data, I am likewise trying to grow my Instagram (@PsychoBabbleLLC) and Facebook following. I’d welcome any insights that you have about the data, how to grow the community, or how to solicit content that fits the mission 🙂
PsychoBabbleLLC@gmail.com
